Antimony UI Drag Function Example
In this tutorial we will add a dragging function to a point. It will change the size of two squares when dragging in the x direction. Their colour will change when dragging in the y direction. This is inspired by the Processing Mouse1D example.
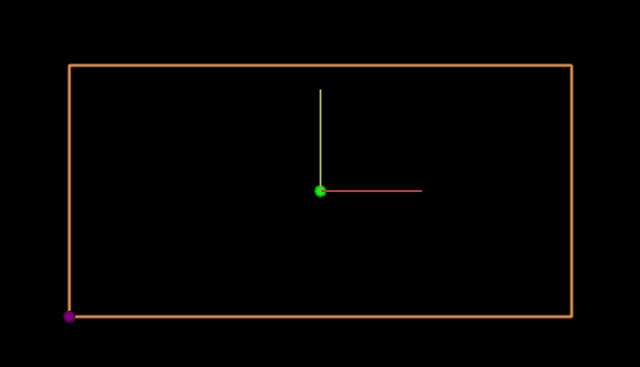
Here is an example of what we will be making! The white arrows represent what direction the point is being dragged with the mouse:
![]()
Step 1
Create a new file in Antimony and add a script node.
First add our inputs and shapes:
import fab

title('Script')

width = 5
height = width/2

input('x', float)
input('y', float)
input('_s1', float)
input('_s2', float)
input('_c1', float)
input('_c2', float)

rectangle_left = fab.shapes.rectangle(x-_s1, x, y-_s1/2, y+_s1/2)
rectangle_right = fab.shapes.rectangle(x, x+_s2, y-_s2/2, y+_s2/2)
s1 and _s2 are scales for the squares. By having an underscore () in front of the input name, it hides it as an input from the node.
_c1 and _c2 will be used for the colour of the squares.
The two squares are next to each other on x, and centered on y/2. This will make more sense when the bounding box is created in the next step.
Step 2
Now add two points and a wireframe:
fab.ui.point(x, y, color=(0,255,0))

fab.ui.wireframe([(x-width/2, y-height/2, 0), (x+width/2, y-height/2, 0),
              (x+width/2, y+height/2, 0), (x-width/2, y+height/2, 0)], close=True, color=fab.color.orange)

fab.ui.point(x-width/2, y-height/2, color=(128,0,128))
The first point (green) is in the middle of the bounding box.
The bounding box is a wireframe in orange.
The second point (purple) is at the lower left corner
Step 3.
We want the purple point to be able to move the x & y coordinates- effectively moving the position of everything.
Add a drag function to the purple point:
fab.ui.point(x-width/2, y-height/2, drag=(x,y,None), color=(128,0,128))
It’s an inline drag function- so when we move the point in the x direction, it will change the x input. Same for y. We don’t have a z point, so it’s set to None.
Step 4.
Dragging the green point should be able to change the size and colour of the squares. This is a bit more involved than using an inline function.
Add a call to a drag function for the green point:
fab.ui.point(x, y, drag=drag_middle, relative=True, color=(0,255,0))
drag=drag_middle is passing what function we want to handle the action
relative=True means that the coordinates in the function will be relative to that point.
Step 5.
Add the drag_middle function above the UI lines:
def drag_middle(this,x,y,z):

if x > 0:
this._s1 -= x
this._s2 += x
if y > 0:
  this._c2 += y
elif y < 0:
  this._c2 -= math.fabs(y)

  elif x < 0:
  this._s1 += math.fabs(x)
  this._s2 -= math.fabs(x)
  if y > 0:
    this._c1 += y
  elif y < 0:
    this._c1 -= math.fabs(y)
The drag function parameters are itself the node, and the coordinates of the mouse.
Input variables are able to be set by using this._s1 (for whatever input).
What is happening here is it's asking if the drag is to the left or the right of the point. Depending on whichever, it adds the x value to _s1 or _s2 (taking the absolute value if x is negative). Similar for y and _c1 and _c2.
Step 6.
Time to output the squares. Add this above drag_middle:
val1 = int(_c1)
val2 = int(_c2)

output('left', fab.shapes.set_color(rectangle_left, val1, 0, 200))
output('right', fab.shapes.set_color(rectangle_right, val2, 0, 200))
Step 7.
Right now when the mouse is dragging the green point, the squares can extend beyond the bounding box.
Add this to the bottom of drag_middle:
if this._s1 < width/8:
  this._s1 = width/8
elif this._s1 > width/2:
  this._s1 = width/2

if this._s2 < width/8:
  this._s2 = width/8
elif this._s2 > width/2:
  this._s2 = width/2
It is setting the maximum and minimum values for the scale.
We can do the same thing for the colours too:
if this._c1 > height/2:
  this._c1 = height/2
elif this._c1 < -height/2:
  this._c1 = -height/2

if this._c2 > height/2:
  this._c2 = height/2
elif this._c2 < -height/2:
  this._c2 = -height/2
Step 8.
Next up the values of _c1 and _c2 have to be mapped from 0-255 instead of -height/2 to height/2.
Replace the val1 and val2 with this:
def map_nums(val, from_nums, to_nums):
  return to_nums[0] + (to_nums[1] - to_nums[0]) * ((val -   from_nums[0]) / (from_nums[1] - from_nums[0]))

val1 = int(map_nums(_c1, [-height/2, height/2], [0, 255]))
val2 = int(map_nums(_c2, [-height/2, height/2], [0, 255]))
Step 9.
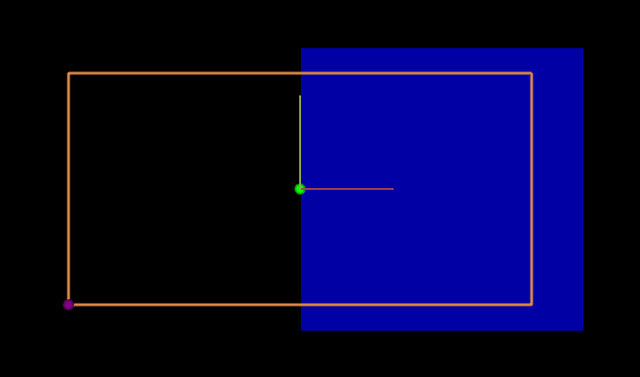
Now when you move the green point in the x direction, the squares change size.
If you’re on the left or right side of the green point and move in the y direction, the square will change its colour.
The colour change is just the red value being more or less, which lets the blue ‘mix in’.
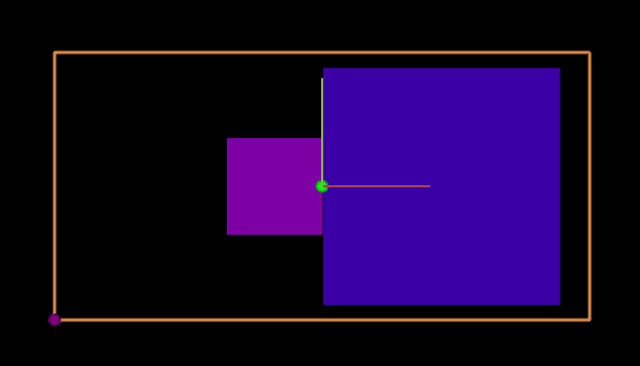
By having two of the scale (_s1 and _s2) and the colour (_c1 and _c2), you can make fun adjustments for each shape. For example, try multiplying _s2 by 2 in the drag_middle function and see what happens.
This is just the start- lots of cool things you can do with dragging functions and points!
Original tutorial by:
-
Licensed under a Creative Commons Attribution-NonCommercial-ShareAlike 3.0 Unported License